GIS Certificate measures pollution before and after COVID
Positive effects of the Pandemic?
During the height of Coronavirus news coverage there was a constant sense of negativity. But there have been upsides with signs that the Earth was healing right before our eyes. An example is that we began to see a change in animal activity after the lockdown. Animals been found entering areas of cities where there is less traffic. Secondly, we see some positive health effects. The CDC reported that influenza cases in 2020 had decreased to only 8% of the cases seen in 2019. Of course, we know spread of disease is mitigated by social distancing. Another noticeable change was that the air quality of large cities globally began to improve. This is due mainly to the reduction of reduction of people driving to work and taking flights. The global system is intricate and we can discover interrelated effects if we look closely.
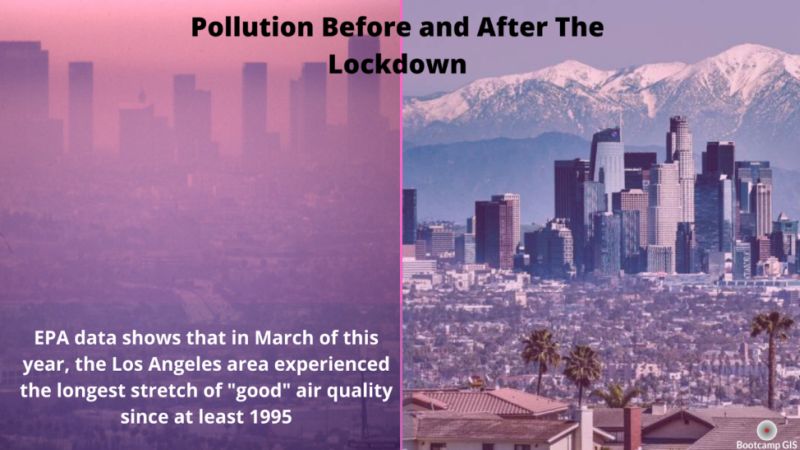
Cleanest air quality since 1995
Scientists believe that 2020 might be the biggest drop of global carbon emissions ever. We reduced our emissions by 5.5% from 2019. Even smog ridden cities have cleaned up their act. In April, a global air quality measurement company determined that Los Angeles at one point had the cleanest air of any major city on Earth. According to the CEO of IQAir Glory Dolphin Hammes, “About a year ago, Los Angeles was ranked the worst air quality in the entire country”. By contrast, the EPA March data showed that the Los Angeles area experienced the longest stretch of “good” air quality since at least 1995. This pandemic has definitely highlighted our need for change within healthcare and business. But also it highlights our need to address climate change.
GIS measures pollution with these apps
Great work is being done in these programs to map out pollution and share it with the world. In all these cases, the work is using large datasets, conflating data from different sources, hosting on cloud servers, and configuring simple user map interfaces.
- World Air Quality Index project – a map of comparable air quality measurement of all major cities.
- World Air Map – a continuous map of global air quality
- Global Alliance on Health Pollution – a set of thematic maps that illustrate different pollution levels
How can you gain GIS skills to measure pollution
If you are a young GIS analyst or student, you probably studied very local issues like a habitat. Then you learned to make project maps on your local computer and software. This is the baseline skill that most GIS Online Certificate Programs teach. In order to address larger issues like climate change and pollution, we encourage you to shoot professionally higher. You can do this by pursuing enterprise skills that teach how to build map systems in the cloud. This includes GIS courses that focus on cloud architecture, data management, data collection workflows, data science, and dashboarding. Let’s elevate more GIS professionals to help convey our knowledge to a new generation of GIS analysts that are eager to use GIS to measure climate change.