Using Online GIS Certificate to measure climate change
GIS is instrumental in world issues
In the last few months, we’ve seen maps describing prominent news issues with Coronavirus updates, and the surging Black Lives Matter movement. At the same time, there have been huge updates in the global climate community. These stories are largely understated when they fall into the mix of all the major 2020 news stories. The first major news story to come out recently was the discovery that this last May was the hottest one on record. As one of the key issues facing mankind, we should be promoting more efforts to use Online GIS Certificates to measure climate change.
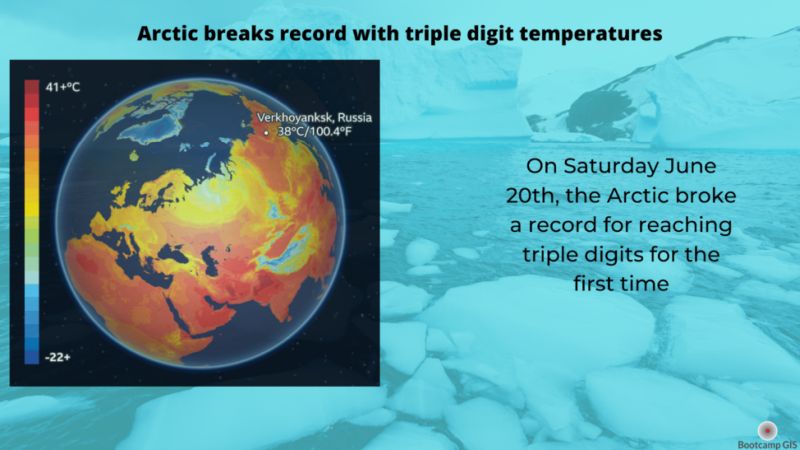
Surging Arctic Circle temperatures
While the world experienced record warm May temperatures, a small town in the Arctic Circle shattered records for temperature a few days ago. In the town of Verkhoyansk, Siberia, the temperature reached 38 degrees Celsius (or 100 degrees Fahrenheit). This temperature is 18 degrees Celsius higher than average. Furthermore, it is the first time in history that an Arctic Circle temperature has reached triple digits. Certainly stories like this could have more impact if told with the right GIS data, stories, and marketing. We need to emphasize that this isn’t a future problem, its a NOW problem.
Focused global climate studies
While warm summers are not uncommon in the Arctic Circle, studies show that the Arctic Circle is warming twice as fast as the rest of the world. According to the article, there has been a constant heatwave in this area even before summer started. In March, April and May the Copernicus Climate Change service reported that the average temperature was around 10C above normal. This is a data point, but how good are the models that we debate about. The NASA Global Climate Change project reproduced observed climate data for the last 50 years and compared them to the models. Unfortunately for the planet, they confirmed the accuracy of global models in their prediction of increased warming.
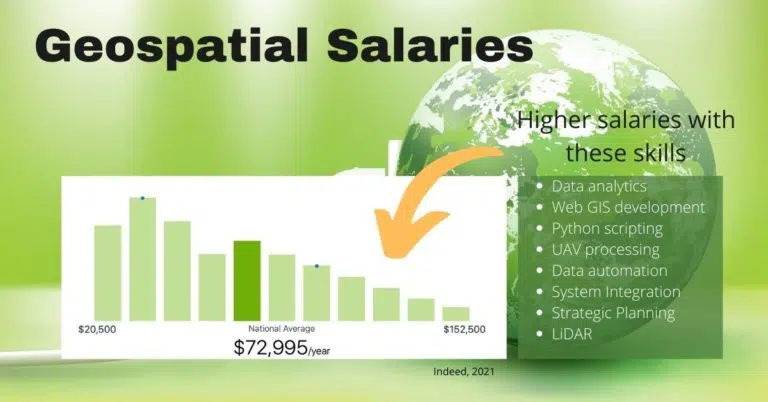
GIS Training skills needed to measure climate change
If you are a young GIS analyst or student, you probably studied very local issues like a habitat. Then you learned to make project maps that were created on your local computer. This is the baseline skill that most GIS Programs Online teach. In order to address larger issues like Global Warming, we encourage you to shoot professionally higher. You can do this by pursuing enterprise skills that teach how to build map systems in the cloud. This includes GIS courses that focus on cloud architecture, data management, data collection workflows, data science, and dashboarding. Let’s elevate more GIS professionals to help convey our knowledge to a new generation of GIS analysts that are eager to use GIS to measure climate change.