Climate Mapping Using GIS Programs Online – 4 Great Examples
What is climate mapping in GIS Programs?
We hear the term climate change often, but sometimes we forget who is measuring it? What technology are they using? What data is collected? Climate change indicators are the statistical differences in temperature and precipitation over time. Moreover, the changing length ranges from the longest billions of years to the shortest interannual variability. Indeed, climate change is a natural and severe problem. Many Scientists agree that human activities are contributing to climate change. Examples are recent rising in average temperature, rising sea levels, warming oceans, and shrinking ice caps. A tool used in the climate community is Climate mapping which is a way to visualize climate change and relate causes to effects.
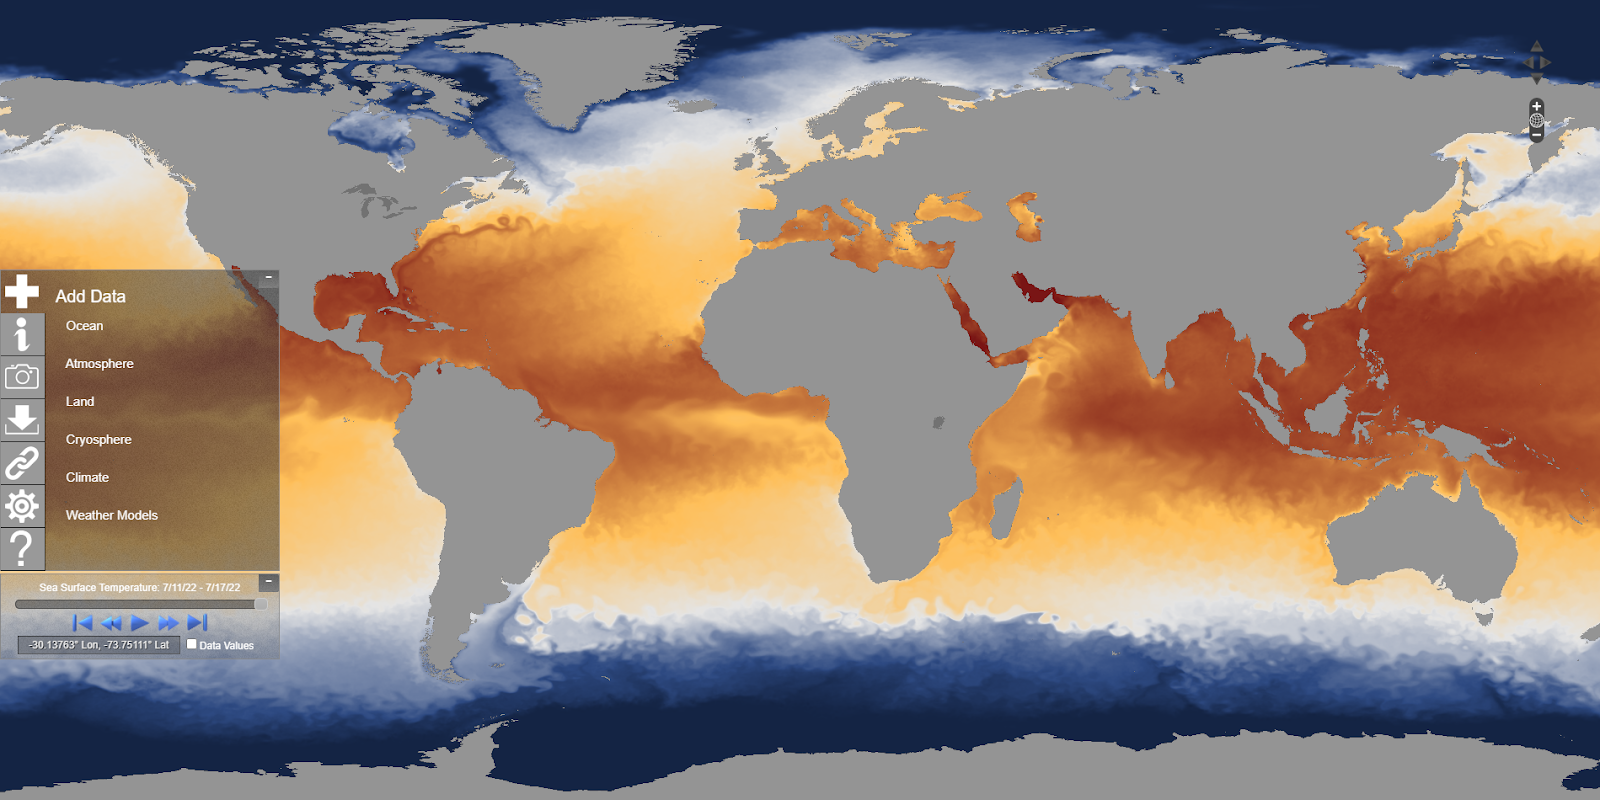
NOAA view global data explorer
National Oceanic and Atmospheric Administration (NOAA) is a U.S.science and technology department. It focuses on changes in the Earth’s atmosphere and oceans. Thus, NOAA studies ways to improve understanding and protection of the environment. It provides online, interactive maps of spatial and temporal changes in deforestation, drought, disasters, disease, food security, water management, climate monitoring, and environmental protection. In this map, we can click the icons on the left to add various elements to the map. And we can drag the time bar to observe the change in the climate.
NASA global maps
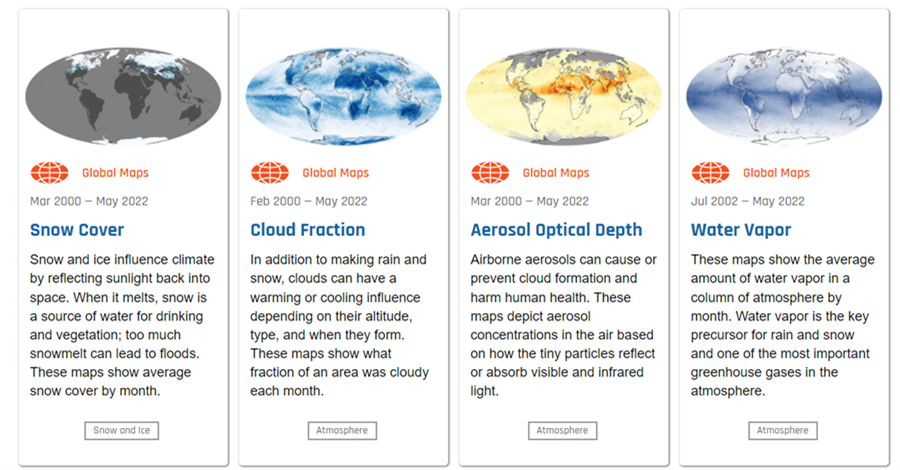
NASA monthly tracks factors such as cloud, snowpack, and sea surface temperature. So it can reflect the state of Earth’s climate through the lens of satellite sensors. NASA maps different climate issues in specific maps. These maps also help us think about the Earth’s overall climate change from the perspective of space. Moreover, they allow scientists to predict the rate of climate change. The following figure is a selection of four maps from the NASA website. It shows us the variation of snow cover, cloud fraction, aerosol optical depth, and water vapor over time.
University of Cambridge’s optimal agriculture map
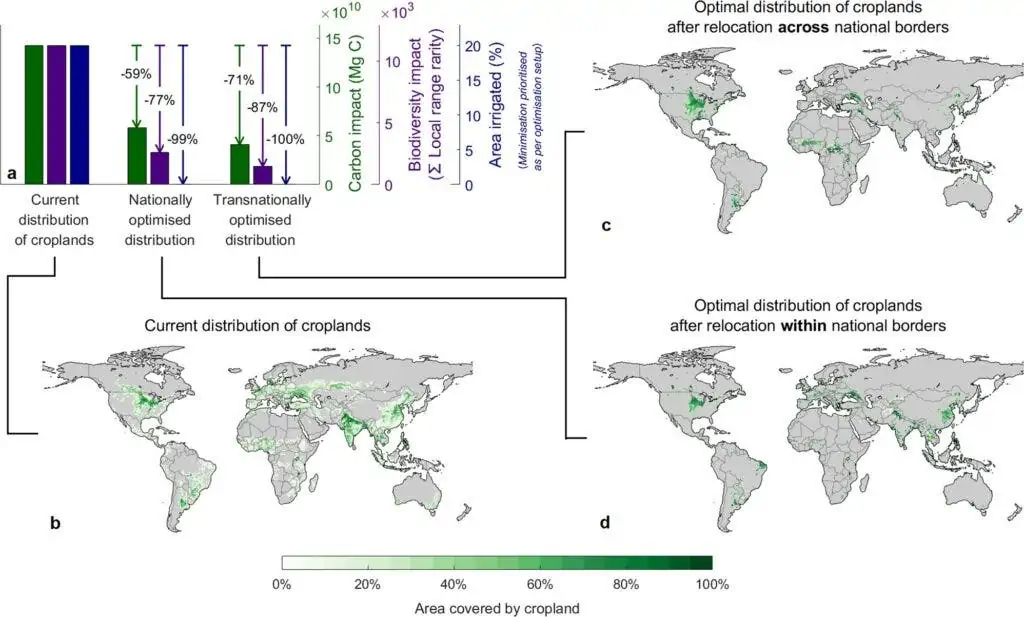
Scholars at the University of Cambridge have studied the damage to ecosystems caused by crops worldwide. This “optimal agriculture map” reflects the best crops to grow in each region. If we can apply the results to other agricultural areas, we see the consequences of environmental damage. When we can’t raise the optimal crops, this results in decreased overall food production.
The Nature Conservancy’s migrations in motion map
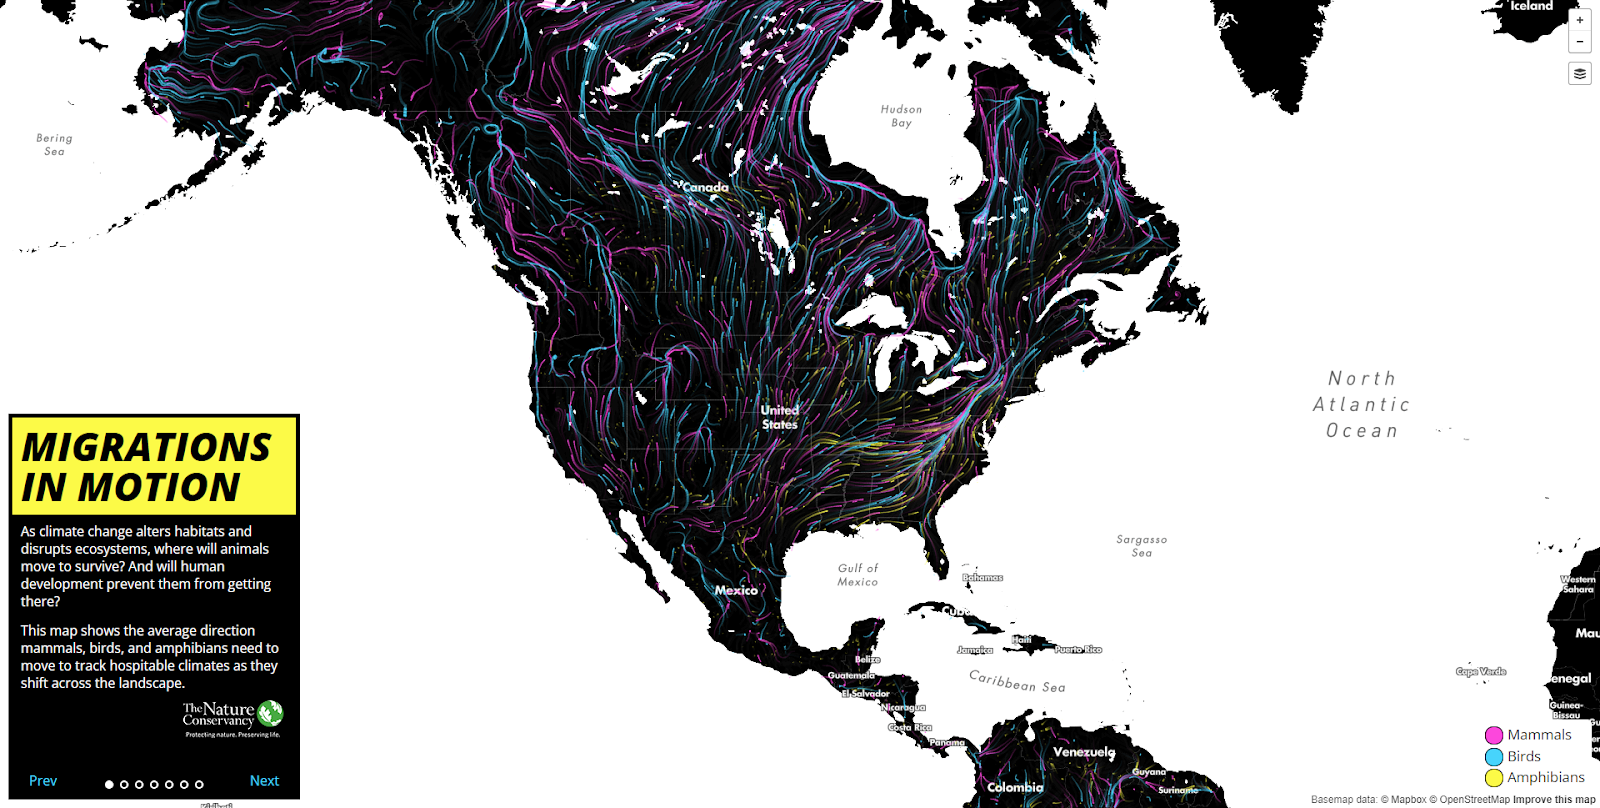
The Nature Conservancy created a dynamic map to reflect the impact of climate change on animal migration. Besides, we can see the migratory paths of mammals, birds, and amphibians. This “migrations in motion” map show us the number and direction of animal migrations in a dynamic way. Additionally, studying this allows us to recognize how human activities indirectly affect animals and provides help for animal conservation.
GIS Program in monitoring climate change
A geographic information system (GIS) provides a platform that allows us to collect, analyze, and visualize data that occur on a local, regional and global scale. It provides a method by which we can understand the world’s climate change with regional measurements over time, such as rainfall or sea level. GIS technology helps environmentalists use climate techniques and mapping to provide more accurate information to the general public. Suppose you want to learn how you can monitor environmental changes and protect the planet we live on. In that case, learning GIS technology could be an interesting environmental tech career path.
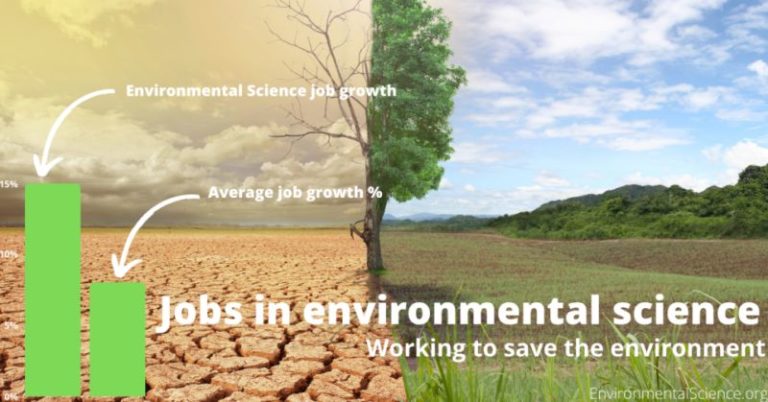
Environmental mapping brings jobs to gis developers
As mentioned earlier, GIS technology and climate change mapping are inextricably linked. Companies and government agencies are opening more and more jobs related to environmental protection. If you want a GIS job in this area that pays well, I highly recommend that you learn GIS technology. Consequently, you could be doing GPS fieldwork, flying UAVs, or creating web applications. Having GIS data analytic skills will make you more marketable.
A career in mapping climate change
According to the U.S. Environmental Protection Agency, climate change is predicted to continue with warmer temperatures. Moreover, precipitation, snowpack, sea level, and ocean acidification are all worsening due to human actions. Therefore, we will need more and more people who can study climate change in the future. If you want to help, learning GIS technology will be a meaningful and marketable career move.