5 ways GIS Programs Online is crucial in climate change mapping
Many jobs in GIS Programs can make a world of difference
As the global community grapples with the pressing challenges of climate change, Geographic Information Systems (GIS) emerge as an indispensable tool in understanding, monitoring, and mitigating its impacts. GIS technology empowers anyone, from researchers to policymakers, to create maps synthesizing complex climate data into a clear visual format. In this article, we explore five key ways GIS is crucial in climate change mapping. It may even inspire you to pursue a career in GIS!
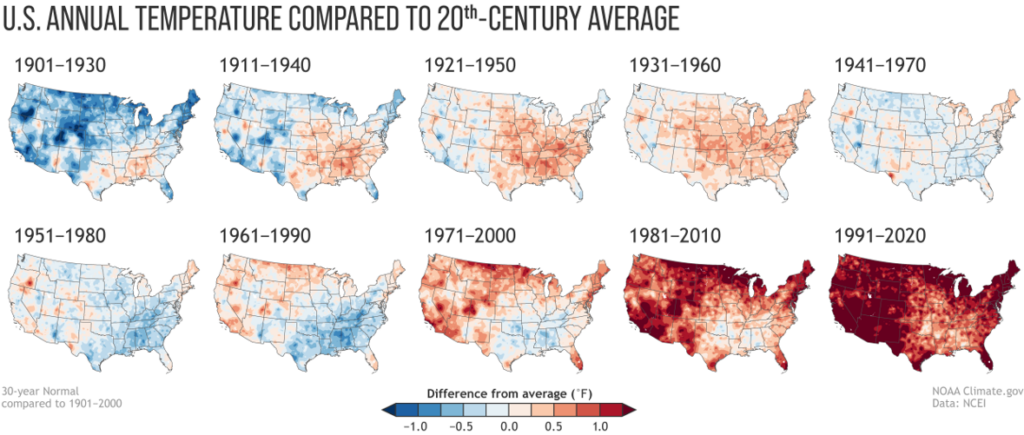
Mapping Temperature
Earth is heating up! The analysis of current and historical weather station data clearly depicts a significant warming trend in average annual global temperature. According to the National Oceanic and Atmospheric Administration’s Annual 2022 Global Climate Report, “The 10 warmest years in the 143-year record have all occurred since 2010, with the last nine years (2014-2022) ranking as the nine warmest years on record.” (NOAA, 2022). GIS enables us to create maps that illustrate these temperature trends. This helps scientists identify hotspots of temperature increase, providing a deeper understanding of regional climate patterns. We then utilize this data to develop targeted strategies for climate adaptation and mitigation.
Mapping Sea Level Rise
Increasing global temperatures create many other environmental issues. Sea level rise due to the melting of glaciers and ice sheets is one of the most striking examples. Rising sea levels pose a significant threat worldwide, putting an estimated 410 million people at risk from coastal flooding by 2100 (Masterson, 2022). These numbers really emphasize the importance of accurate data and mapping to make informed decisions. GIS allows researchers to model the potential impacts of sea level rise by combining elevation data with climate change predictions. This spatial analysis helps identify vulnerable areas, especially those supporting large populations. Adaptive strategies such as coastal defenses and early warning systems are then developed to mitigate the risks associated with rising sea levels.
Mapping Hurricanes
Another consequence of global warming will likely be an increase in intensity of storms and hurricanes. Climate models predict that hurricanes will bring heavier rainfall and pose a greater risk for coastal flooding. GIS technology enhances our ability to track and predict the strength and trajectory of hurricanes, which is critical information for disaster preparedness. When I was young, a category 4 hurricane hit the island of Kaua’i, causing catastrophic damage and demolishing my childhood home. Consequently, I understand firsthand how crucial accurate and reliable data and communication is in this type of emergency. By integrating meteorological data, GIS facilitates real-time mapping of hurricane paths, potential impact zones, and evacuation routes. As a result, authorities are equipped to make informed decisions, allocate resources efficiently, and enhance community resilience in the face of increasingly severe tropical storms linked to climate change.
Mapping Wildfire
The increasing frequency and intensity of wildfires are direct consequences of climate change, necessitating the proactive strategies for wildfire management. According to a 2016 study, climate change has “enhanced the drying of organic matter and doubled the number of large fires between 1984 and 2015 in the western United States” (NOAA, 2023). GIS aids in mapping wildfire-prone areas, identifying factors such as vegetation density, weather conditions, and historical fire patterns. By analyzing this spatial data, experts can implement targeted fire prevention measures, strategically deploy firefighting resources, and develop evacuation plans to safeguard communities in the line of fire.
Mapping Air Pollution
Air pollution, including greenhouse gases, has a significant impact on climate change. GIS is instrumental in mapping and analyzing air pollution, offering a comprehensive view of its sources, dispersion patterns, and potential health impacts. By integrating data from monitoring stations and satellite imagery, GIS allows for the creation of spatially accurate air quality maps. These maps aid in identifying pollution hotspots, understanding the dynamics of pollutant transport, and formulating effective policies to address air quality issues, crucial for public health, environmental sustainability, and environmental justice. GIS is also a critical tool in implementing new green energy options. This will subsequently help to significantly reduce air pollution and the impacts of climate change.
GIS Careers to Combat Climate Change
In the face of escalating climate change challenges, GIS emerges as a powerful ally in our quest for sustainable solutions. The increasing relevance of GIS in climate change mapping underscores the importance of acquiring skills in this technology. A GIS certification is a great way to tech-enable your career for a fraction of the cost and time as a college degree. Learning GIS not only equips you with the tools to understand the intricate dynamics of temperature change, sea level rise, hurricanes, wildfires, and air pollution, but also opens up avenues for impactful careers in environmental science, climate research, and sustainable development. Explore your career potential with the GIS jobs report. Armed with this spatial knowledge, we can make informed decisions towards a resilient and sustainable future.